American Daddy Trader
  • Politics
  • Business
  • Stock
  • Editor’s Pick
  • Politics
  • Business
  • Stock
  • Editor’s Pick

American Daddy Trader

Stock

Market Pullbacks Provide Opportunities to Build your WatchList – Here’s How

by admin January 12, 2025
January 12, 2025
Market Pullbacks Provide Opportunities to Build your WatchList – Here’s How

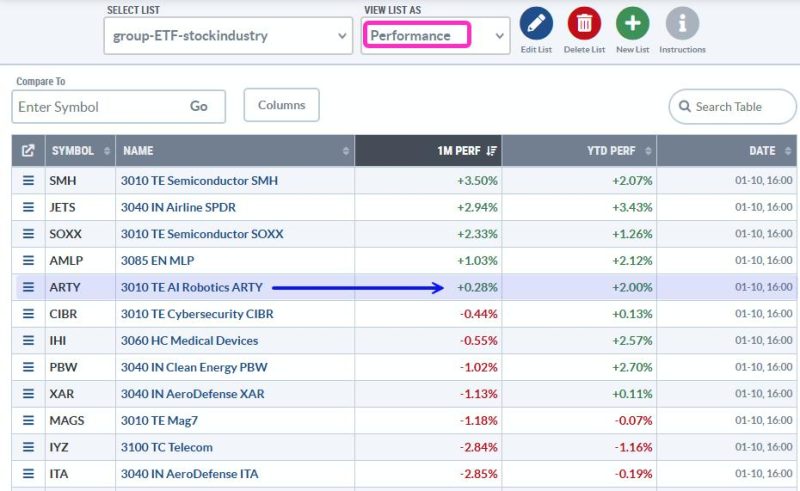
The stock market is in pullback mode with the S&P 500 EW ETF down 5.15% over the past month and down 1% year-to-date. This makes it a good time to monitor relative performance and create a relative strength watch list. Stocks and ETFs holding up best during pullbacks often lead when the market regains its footing. Today’s report will show a starter list and analyze the chart for an AI Robotics ETF.

The table below shows 1-month and year-to-date performance for a selection of industry group ETFs. With the S&P 500 EW ETF down on both timeframes, ETFs with gains are holding up well and ETFs with smaller losses show relative strength (less weakness). Five ETFs are up on both timeframes and holding up well in the face of broad market weakness.

Note that this list is simply the first cut. I would make a further cut by insuring that the ETF is in a long-term uptrend. For example, the Clean Energy ETF (PBW) is below its 200-day SMA and would not make the cut. The Medical Devices ETF (IHI) and Robotics AI ETF (ARTY) are in long-term uptrends, and make the cut. Let’s look at ARTY. A recent Chart Trader report/video highlighted the recent breakout in IHI.

The chart below shows ARTY hitting a new high in early December and price above the rising 200-day SMA. ARTY is in a long-term uptrend. There was a big breakout in mid October, an oversold reading in late October and then a 17% run to new highs. ARTY then formed a pennant and broke out with a surge earlier this week, only to fall back the last three days. Overall, I think the pennant breakout is still bullish and this is a throwback to the breakout zone. A break below the pennant lows would negate this pattern and argue for a deeper correction.

Chart Link

The middle window shows the price-relative (ARTY/RSP Ratio) breaking above its 200-day SMA in late November. ARTY shows relative strength and the price-relative hit a new high in early January. The lower window shows %B, which I use to identify oversold conditions within an uptrend. A dip below 0 means the close is below the lower Bollinger Band. This means there was a pullback within the uptrend, which is an opportunity.

I will be following ARTY and other leading ETFs closely in the Chart Trader reports and videos. Our reports warned of the breakout in the 10-yr Treasury Yield in before Christmas (HERE) and we also showed how to distinguish between a robust bounce and a dead cat bounce (HERE).

Click here to take Chart Trader trial and get immediate access.

//////////////////////////////////////////////////
previous post
Don’t worry. There is a common sense response to the surgeon general’s alcohol and cancer warning
next post
Week Ahead: NIFTY Steps Into Next Week With These Two Negative Technical Developments

You may also like

Double Tops on Bitcoin and the Dollar

February 15, 2025

Week Ahead: NIFTY May Stay Ranged; Trending Moves...

October 20, 2024

Bearish ADX Signal on S&P Plays Out –...

March 13, 2025

Growth Stocks Tumbling; Where to Find Safe Havens...

March 1, 2025

The SCTR Report: Insmed’s Stock Hangs in the...

September 13, 2024

How to Chart In Multiple Timeframes Like A...

April 20, 2024

Key Levels for the S&P 500: Has It...

April 10, 2025

Week Ahead: What Should You Do As Nifty...

April 19, 2025

Is This the Magic Upward Break Everybody Was...

May 18, 2024

Is this Bounce a Robust Rebound or a...

December 27, 2024

    Stay updated with the latest news, exclusive offers, and special promotions. Sign up now and be the first to know! As a member, you'll receive curated content, insider tips, and invitations to exclusive events. Don't miss out on being part of something special.


    By opting in you agree to receive emails from us and our affiliates. Your information is secure and your privacy is protected.

    Recent Posts

    • Three Sectors Stand Out and One Sports a Bullish Breakout

      June 14, 2025
    • Is a Bold Rotation Brewing in Healthcare and Biotech? Here’s What to Watch Now

      June 14, 2025
    • Bearish Divergence Suggests Caution For S&P 500

      June 14, 2025
    • How close was Iran to a nuclear weapon before Israel’s strike on Tehran?

      June 14, 2025
    • Iran threatens to hit US bases in the Middle East: What is the threat level?

      June 14, 2025

    Archives

    • June 2025
    • May 2025
    • April 2025
    • March 2025
    • February 2025
    • January 2025
    • December 2024
    • November 2024
    • October 2024
    • September 2024
    • August 2024
    • July 2024
    • June 2024
    • May 2024
    • April 2024
    • March 2024
    • February 2024
    • January 2024

    Categories

    • Business
    • Editor's Pick
    • Politics
    • Stock
    • Uncategorized
    • About us
    • Contact us
    • Privacy Policy
    • Terms & Conditions

    Copyright © 2025 americandaddytrader.com | All Rights Reserved