American Daddy Trader
  • Politics
  • Business
  • Stock
  • Editor’s Pick
  • Politics
  • Business
  • Stock
  • Editor’s Pick

American Daddy Trader

Stock

How to Trade Erratic Uptrends – An Example and Setup using IWM

by admin January 4, 2025
January 4, 2025
How to Trade Erratic Uptrends – An Example and Setup using IWM

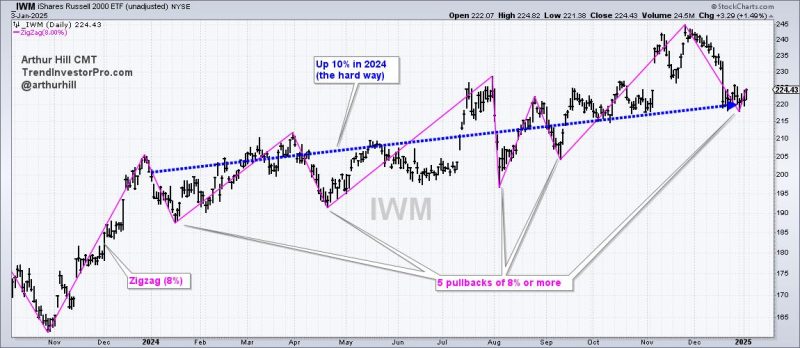
The Russell 2000 ETF managed a double-digit gain in 2024, but did it the hard way with several deep pullbacks. Pullbacks within uptrends are opportunities and we can find such opportunities using %B.

The chart below shows the Russell 2000 ETF (IWM) with the Zigzag(8) indicator. This indicator changes direction when there is a move greater than 8%, which means it ignores price moves that are less than 8%. I am showing this indicator to highlight five pullbacks of 8% or more in 2024. That’s a lot. In contrast, the S&P 500 SPDR (SPY) only experienced one 8+ percent pullback in early August.

Overall, IWM advanced 10% in 2024. That seems like a good year, but it was a “hard” 10% when we include the five 8+ percent pullbacks. This is simply the nature of small-cap stocks. They are less “trendy” than large-caps and have higher betas, making them more susceptible to wider fluctuations. Traders need to consider this when trading small-caps. As noted in Chart Trader this week, we see similar price action in the S&P 500 EW ETF (RSP) and S&P MidCap 400 SPDR (MDY).

Click here to take Chart Trader trial and get immediate access.

Buying upside breakouts is probably not the best strategy for trading IWM. Instead, traders should consider pullbacks and mean-reversion opportunities. We can identify such opportunities using Bollinger Bands (20,2) and %B (20,2). The middle line on the Bollinger Bands is the 20-day SMA and the bands are two standard deviations above and below. A close below the lower band means price fell two standard deviations and this creates an oversold condition.

Chartists can quantify oversold conditions using %B, which falls below 0 when the close is below the lower Bollinger Band. The blue lines on the chart above show %B dipping below 0 four times in 2024. Note that I would also only look for oversold conditions when price is above the 200-day SMA (long-term uptrend). When the bigger trend is up, a close below the lower Bollinger Band signals an oversold condition that can lead to a bounce.

December was a rough month for many stocks and ETFs. Even so, the weight of the evidence remains bullish for stocks and these pullbacks look like corrections within bigger uptrends. This week’s reports and videos focused on long-term breadth indicators, short-term oversold breadth, leading ETFs and a dozen ETFs with tradable pullbacks.

Click here to take a Chart Trader trial and get immediate access.

///////////////////////////////////////////////

previous post
Mike Johnson re-elected House speaker as GOP mutiny threat dissolves
next post
The Best Five Sectors, #1

You may also like

Apple Blasts Through $200 On AI Optimism

June 12, 2024

These Riskier Areas Start the New Year RALLY!

January 4, 2025

AI Boom Meets Tariff Doom: How to Time...

December 21, 2024

Top 5 Breadth Indicators You Can’t Afford to...

October 29, 2024

Week Ahead: NIFTY Violates Key Support Levels; Drags...

October 27, 2024

Generals March On, but Fewer Troops are Following...

February 4, 2024

Biotechnology (IBB) Gets Silver Cross BUY Signal

May 17, 2024

Here’s Why the Small Cap IWM Will Soar...

November 28, 2024

Equities Say “Go Fish”; How “Healthy” are the...

September 10, 2024

Unlocking GDX’s Short-Term Potential: How to Nail the...

September 28, 2024

    Stay updated with the latest news, exclusive offers, and special promotions. Sign up now and be the first to know! As a member, you'll receive curated content, insider tips, and invitations to exclusive events. Don't miss out on being part of something special.


    By opting in you agree to receive emails from us and our affiliates. Your information is secure and your privacy is protected.

    Recent Posts

    • Generate Consistent Income with These Options Strategies

      May 22, 2025
    • Quantum Stocks Explode: Why Traders Are Obsessed With QBTS and RGTI Right Now

      May 22, 2025
    • Become the Investor You Aspire to Be: Essential Insights for Success

      May 22, 2025
    • Controversial office vacant for first time in nearly a decade, but emerging secrets haunt those involved

      May 22, 2025
    • South African-born Musk evoked by Trump during meeting with nation’s leader: ‘Don’t want to get Elon involved’

      May 22, 2025

    Archives

    • May 2025
    • April 2025
    • March 2025
    • February 2025
    • January 2025
    • December 2024
    • November 2024
    • October 2024
    • September 2024
    • August 2024
    • July 2024
    • June 2024
    • May 2024
    • April 2024
    • March 2024
    • February 2024
    • January 2024

    Categories

    • Business
    • Editor's Pick
    • Politics
    • Stock
    • Uncategorized
    • About us
    • Contact us
    • Privacy Policy
    • Terms & Conditions

    Copyright © 2025 americandaddytrader.com | All Rights Reserved