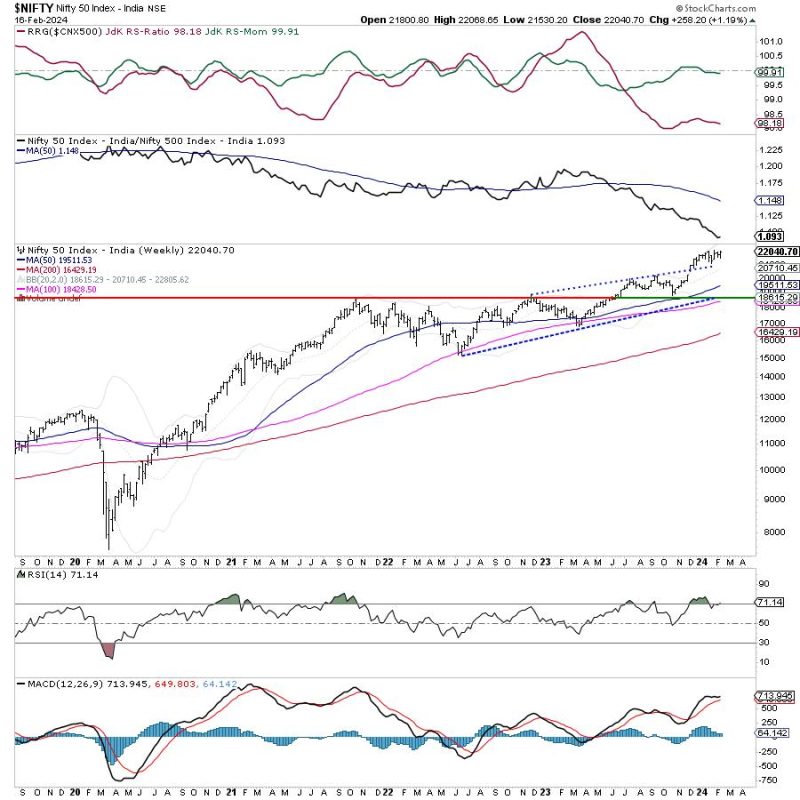
Some serious consolidation continued in the markets as the Nifty oscillated in a defined range before closing the week with modest gains. Examination of daily charts shows that the Nifty tested its 50-DMA again and rebounded from that level while defending that point as important support. The trading range widened a bit. The Nifty Index oscillated in a 538-point range over the past five sessions. While staying largely under broad but defined consolidation, the headline index closed with a net gain of 258.20 points (+1.19%).
From a technical standpoint, while the markets continue to consolidate, the levels of 50-DMA is the most important support. This level currently stands at 21566. As of now, the markets are within a clear and defined trading range of 22100-21500 levels. While the Index may continue to oscillate back and forth in this range, it is likely to stay devoid of any sustained directional bias. A definite trend shall emerge only if the Nifty is able to convincingly take out 22100 levels or ends up violating 21500 on a closing basis. Volatility stood still; India VIX declined by 1.46% to 15.22 on a weekly basis.
Monday is likely to see a quiet start to the trade. While a flat opening is expected, the Nifty is likely to find resistance at 22150 and 22300 levels during the week. The supports come in at 21800 and 21620 levels.
The weekly RSI is 71.14. While the RSI stays in a mildly overbought zone, it stays neutral and does not show any divergence against the price. The weekly MACD continues to stay bullish and above its signal line.
The pattern analysis of the daily charts shows that the breakout that the Nifty achieved by crossing above 20800 continues to remain valid and in force. However, going by the present price action, the Nifty is consolidating near its high point in a defined trading range. A directional trend shall emerge if the Nifty moves past 22100 or slips below 21500 levels. Until this happens one can fairly see the markets continuing to consolidate.
The coming week is likely to see the Nifty staying in a defined range as mentioned. We will continue to see some defensive pockets continuing to do well; besides this, it is also expected that PSU/PSE stocks that were taking a breather may see a fresh set of relative outperformance along with stock-specific moves from the private banking space. However, until a clear trend emerges, it is strongly recommended that large leveraged positions should be avoided; also going forward, unless a strong extension of upmove is seen, all profits must be protected vigilantly at higher levels.
Sector Analysis for the coming week
In our look at Relative Rotation Graphs®, we compared various sectors against CNX500 (NIFTY 500 Index), which represents over 95% of the free float market cap of all the stocks listed.
Relative Rotation Graphs (RRG) continue to show a similar sectoral setup with no major change over the previous week. The Nifty Energy, PSE, PSU Bank, Infrastructure, Metal, Commodities, IT, and Realty Indices are inside the leading quadrant. While the Realty Index is seen giving up on its relative momentum, this group is likely to relatively outperform the broader Nifty 500 Index.
While staying inside the weakening quadrant, the Nifty Pharma Index is seen improving its relative momentum against the broader markets. Besides this, the Nifty Midcap 100 index is also inside the weakening quadrant.
The Nifty Media, Banknifty, and Financial Services index continue to languish inside the lagging quadrant along with the Services Sector index.
The Nifty FMCG and Consumption Sector indices also remain inside the lagging quadrant.
Important Note: RRG charts show the relative strength and momentum of a group of stocks. In the above Chart, they show relative performance against NIFTY500 Index (Broader Markets) and should not be used directly as buy or sell signals.
Milan Vaishnav, CMT, MSTA
Consulting Technical Analyst

